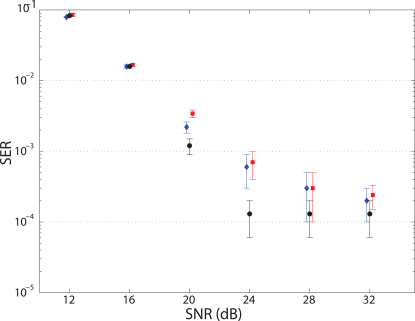
Figure 4. Results for nonlinear channel equalization.
The horizontal axis is the Signal to Noise Ratio (SNR) of the channel. The vertical axis is the Symbol Error Rate (SER), that is the fraction of input symbols that are misclassified. Results are plotted for the experimental setup (black circles), the discrete simulations based on eq. (5) (blue rhomboids), and the continuous simulations that take into account noise and bandpass filters in the experiment (red squares). All three sets of results agree within the statistical error bars. Error bars on the experimental points relative to 24, 28 and 32 dB might be only roughly estimated (see Supplementary Material). The results are practically identical to those obtained using a digital reservoir in4.

