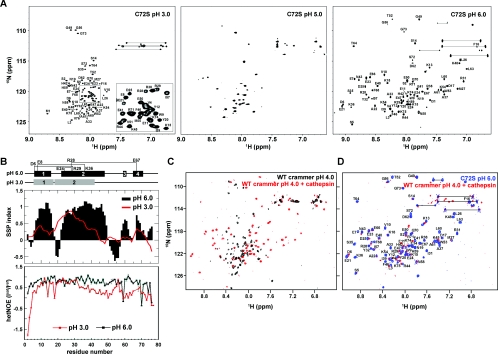
Figure 4. 1H-15N-HSQC Spectra.
(A) 1H-15N-HSQC spectra of C72S as a function of pH. The assigned cross-peaks for C72S at pH 3.0 and pH 6.0 are labelled in the Figure. The inset shows an expanded view of part of the spectrum. (B) Secondary structure propensity and hetNOEs of C72S residues. Upper panel: secondary structure propensity (SSP) compared with C72S residue number. Red line, pH 3.0; black bars, pH 6.0. Positive values indicate α-helical propensity, and negative values indicate β-strand propensity. Lower panel: hetNOE values used to investigate the femtosecond-to-picosecond dynamics of C72S. Residues in folded regions have larger hetNOE values. The α-helical regions and the salt bridges are depicted schematically at the top of the Figure. (C) 1H-15N-HSQC spectra of wild-type (WT) crammer (pH 4.0) in the absence (black) or presence of Drosophila cathepsin L (red). (D) The spectra of the Drosophila cathepsin L/crammer complex (red) and C72S (blue). The C72S cross-peaks are labelled.

