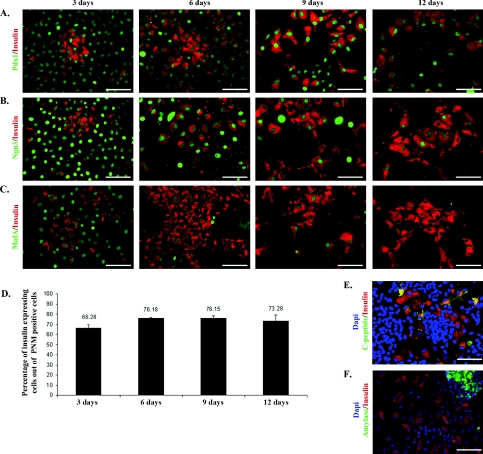
Figure 2. Expression of insulin and exogenous Pdx1, Ngn3, MafA.
B13 cells were fixed and stained 3, 6, 9, 12 days after Ad-PNM transduction. Cells were then co-stained for insulin (red) and Pdx1 (green) (A), insulin (red) and Ngn3 (green) (B), insulin (red) and MafA (green) (C). (D) Percentage of insulin-positive cells out of the population of PNM-positive cells. Data are means±S.E.M. (n=3). (E) C-peptide (green), insulin (red) and DAPI (blue) at day 12. (F) Amylase (green), insulin (red) and DAPI (blue) at day 6. Scale bars=100 μm.

