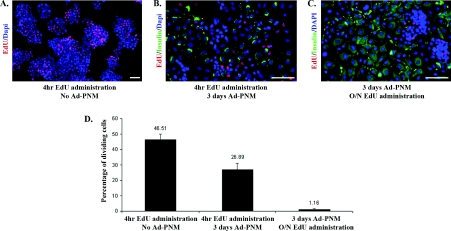
Figure 3. Cell proliferation assay with EdU.
(A) B13 cells were given EdU for 4 h. Then they were fixed and stained for EdU (red) and DAPI (blue). (B) B13 cells were given EduU for 4 h. Then the cells were transduced with Ad-PNM. At 3 days later, cells were fixed and stained for EdU (red), insulin (green) and DAPI (blue). (C). B13 cells were transduced with Ad-PNM. At 3 days later these cells were given EdU overnight. Next day they were fixed and stained for EdU (red), insulin (green) and DAPI (blue). Scale bars=100 μm. The red colour is slightly enhanced in (B and C) to be consistent with (A). (D) Left-hand bar: percentage of proliferating cells out of total population. Middle and right-hand bars: percentage of proliferating insulin-positive cells out of total insulin-positive cells. Data are means±S.E.M. (n=3).

