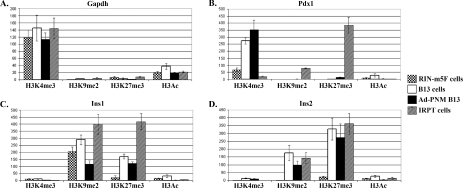
Figure 5. Changes of the histone tail modifications at the promoter regions of the Pdx1, Ins1 and Ins2 genes.
ChIP assays were carried out to compare the proportion of the histone tail modifications (H3K4Me3, H3K9Me2, H3K27Me3 and H3Ac) at the promoters of the Gapdh (A), Pdx1 (B), Ins1 (C) and Ins2 (D) genes. The cell types analysed are RIN-m5F cells (stippled bars), B13 cells without Ad-PNM (open bars), B13 cells with Ad-PNM (closed bars) and IRPT cells (diagonal hatched bars). The y-axis shows fold change of samples over negative control rat IgG. Data are means±S.E.M. (n=3).

