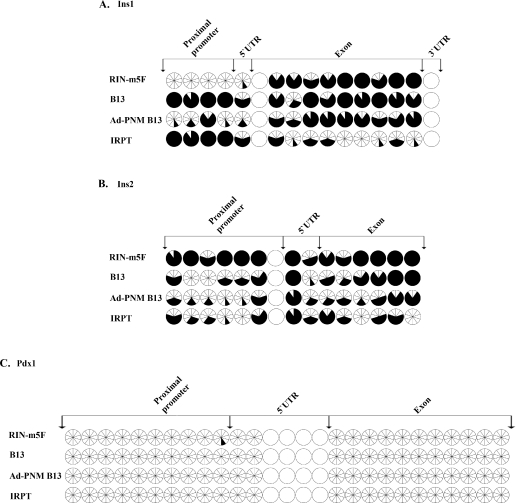
Figure 6. Changes of the DNA methylation pattern of the Pdx1, Ins1 and Ins2 genes after transduction with Ad-PNM.
Comparison of the CpG methylation pattern of the Ins1 (A), Ins2 (B) and Pdx1 (C) genes in RIN-m5F cells, B13 cells with and without Ad-PNM, and IRPT cells. Each circle, divided into ten wedges, represents ten different clones for the same CpG. Open wedges represent unmethylated CpGs and closed wedges represent methylated CpGs. Intact open circles represent CpGs that were not covered by the bisulfite sequencing. UTR, untranslated region.

