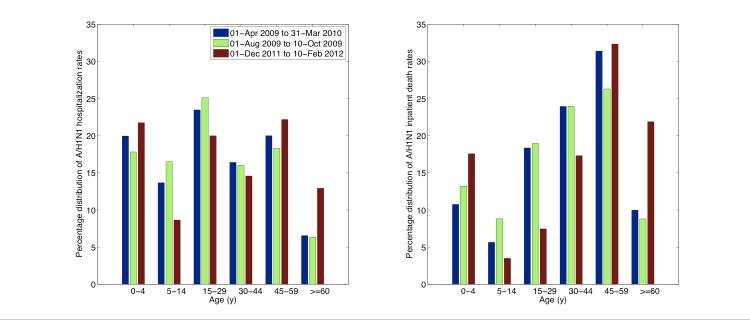
Figure 5: Relative distribution of age-specific A/H1N1 influenza hospitalization rates (left) and A/H1N1 inpatient death rates (right) for the ongoing A/H1N1 influenza epidemic (01-Dec 2011 to 10-Feb 2012) compared to those of the entire 2009 A/H1N1 pandemic period (01-Apr 2009 to 31-Mar 2010) and to the first 70 days of the 2009 fall pandemic wave (01-Aug 2009 to 10-Oct 2009).

An official website of the United States government
Here's how you know
Official websites use .gov
A
.gov website belongs to an official
government organization in the United States.
Secure .gov websites use HTTPS
A lock (
) or https:// means you've safely
connected to the .gov website. Share sensitive
information only on official, secure websites.
