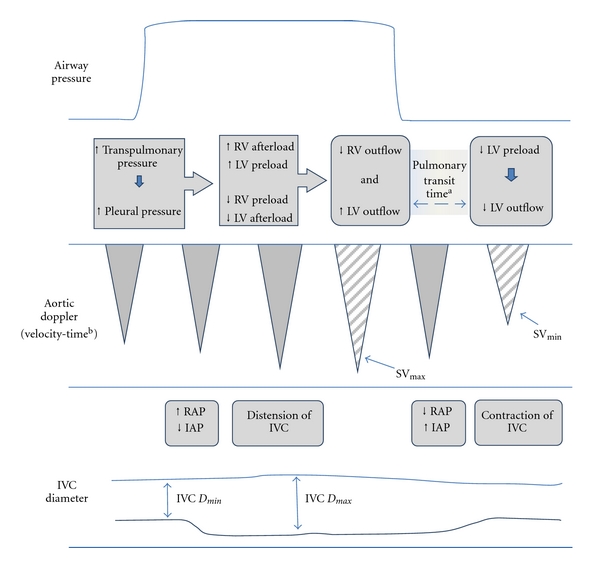
Figure 1.

The physiological explanation for the changes in stroke volume and IVC diameter caused by mechanical ventilation. RV right ventricle, LV left ventricle, SVmax and SVmin maximum and minimum stroke volume, RAP right atrial pressure, IAP intraabdominal pressure, IVC D max and IVCmin maximum and minimum inferior vena cava diameter during the cycle. aThe pulmonary transit time represents the time taken for blood to travel through the pulmonary circulation. bSV is the product of the velocity-time integral (area under the Doppler signal curve) and the diameter of the vessel at the point the reading was taken.
