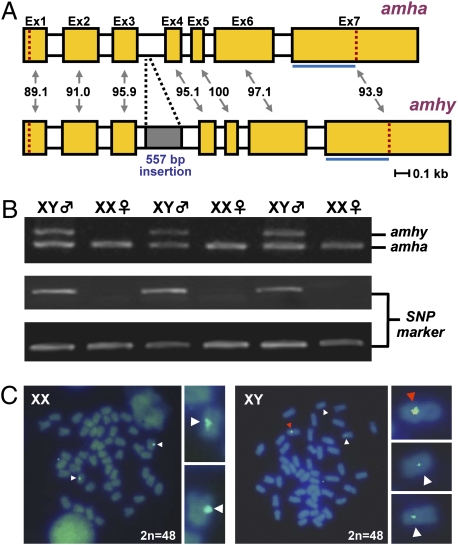
Fig. 1.
amhy gene structure, relation with SNP marker and phenotypic sex, and physical mapping. (A) Schematic representation of amhy and amha gene structure in O. hatcheri. Exons (Ex1 to Ex7) are represented by filled boxes, and the percentage identity between corresponding exons is indicated. Open segments represent introns, and the gray-shaded area shows the location of the insertion in the amhy third intron. The location of the TGF-β domain (blue line) and of the start and stop codons (red dotted lines in the first and seventh exons, respectively) are indicated. (B) Pattern of amha (1,057 bp; Top panel, lower band) and amhy (1,614 bp; Top panel, upper band) amplification using primers flanking the third intron and of the sex-linked SNP marker in sex genotyping. Results show complete matching between genotypic sex (inferred by both amhy amplification and SNP marker) and phenotypic sex (only six animals are shown). (Middle) The SNP marker shows the amplification of the male-specific PCR fragment, and the Bottom lane the respective control. (C) Fluorescence in situ hybridization using as probe the amhy gene and its 5′ flanking region (7.3 kb) on metaphase spreads from XX and XY fish. The fragment was based on the amhy sequence but the probe hybridizes also to amha. XX individuals show two signals in a pair of acrocentric/telocentric chromosomes whereas XY individuals show, in addition to this pair of signals (presumptive amha), a strong signal (presumptive amhy) in a single metacentric/submetacentric chromosome.

