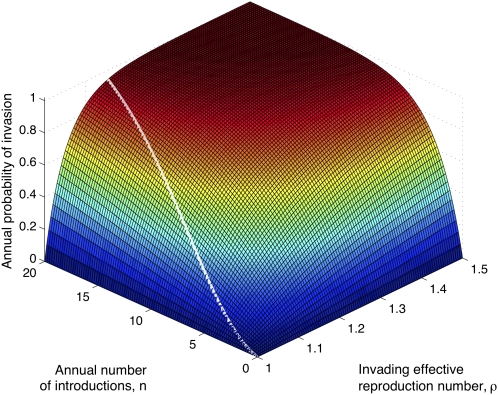
Fig. 4.
A simple schematic model illustrating the effect of cross-protective vaccination. The surface plots the annual probability of emergence of a zoonotic pathogen, one undergoing n introductions per year (x axis) with reproduction number ρ (y axis). For illustration, the white line indicates a subset of this surface relevant to influenza strain replacement, a downward trajectory denoting the effect of vaccination. Any single point on the line corresponds to a choice of RV, the reproduction number in the presence of vaccination and in the absence of HA immunity (see Eq. S3, and the comment thereafter). In the context of the epochal model, effects associated with both n and ρ make comparable contributions to slowing HA drift (SI Materials and Methods).

