Fig. 2.
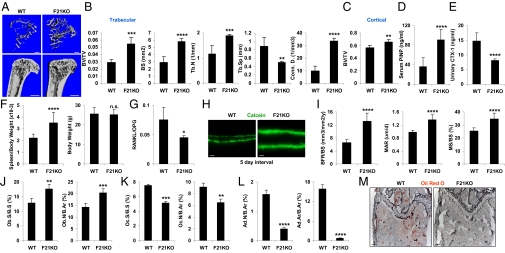
Genetic FGF21 loss of function increases bone mass. (A–C) FGF21-KO mice displayed a high-bone-mass phenotype. Tibiae from FGF21-KO or WT controls (4 mo old, male, n = 4) were analyzed by μCT. (A) Representative images of the trabecular bone of the tibial metaphysis (Upper) and the entire proximal tibia (Lower). (Scale bars: Upper, 10 μm; Lower; 1 mm.) (B) Quantification of trabecular bone volume and architecture. (C) Cortical BV/TV was increased. (D) Serum PINP was increased (4 mo old, male, n = 7). (E) Urinary CTX-1 was decreased (4 mo old, male, n = 7). (F) FGF21-KO mice had a greater spleen/body weight ratio (Left) with unaltered body weight (Right) (6 mo old, male, n = 20). (G) Expression of RANKL/OPG mRNA ratio in the tibiae (n = 4). (H and I) Dynamic bone histomorphometry (2 mo old, male, n = 6). Calcein was injected 2 and 7 d before bone collection. (H) Representative images of the femoral sections. (Scale bars, 10 μm.) (I) Quantification of BFR/BS, MAR, and MS/BS. (J–M) Static bone histomorphometry showed increased osteoblasts but decreased osteoclasts and adipocytes in the femurs of FGF21-KO mice (6 mo old, male, n = 6). (J) Osteoblast surface and number. (K) Osteoclast surface and number. (L) Adipocyte number and area. (M) ORO-stained femoral sections. Adipocytes were ORO+ (red) cells. (Scale bars, 100 μm.) *P < 0.05; **P < 0.01; ***P < 0.005; ****P < 0.001; n.s. nonsignificant (P > 0.05).

