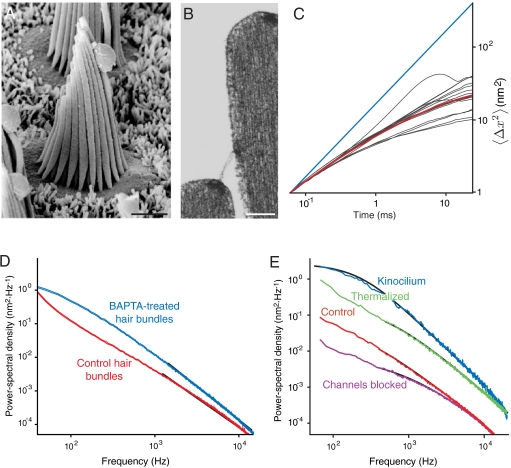
Fig. 1.
Subdiffusive movement of the hair bundle. (A) A scanning electron micrograph depicts a hair bundle from the bullfrog’s sacculus. The axis of mechanosensitivity corresponds to the plane of the illustration; the direction of excitatory mechanical stimulation is to the right. The scale bar represents 2 μm. (B) A transmission electron micrograph portrays the tops of two stereocilia joined by an obliquely oriented tip link, which is thought to be attached at its lower insertion to two transduction channels. The scale bar represents 100 nm. (C) A plot of a hair bundle’s mean square displacement demonstrates that an intact bundle performs subdiffusion. The values of  for 16 hair cells are shown in gray and their average in red. For comparison, ordinary diffusion defined by the relation
  is indicated by a blue reference line. (D) The average power spectrum (red) from the 16 intact hair bundles in (C) displays a limiting slope near -1.75 (underlying black line). Cutting the tip links with BAPTA in 11 cells yields a spectrum (blue) with a slope near -2 (underlying black line) characteristic of ordinary diffusion. The shaded areas represent 99% confidence intervals obtained by bootstrapping. (E) The power spectrum of a hair bundle at thermal equilibrium after treatment with NaN3 (green) displays subdiffusion. A fit with the Mittag-Leffler function (underlying black line) yields a coefficient of α = 0.77. The power spectra of another hair bundle also display subdiffusion, both when its channels are intact (red, α = 0.69) and when they are blocked with 5 mM amiloride (magenta, α = 0.74). The difference in the magnitudes of the fluctuations between the two hair bundles results primarily from differences in the positions of the laser beams. By contrast, the spectrum for a single kinocilium (blue) accords with ordinary diffusion; the coefficient for fitting a Mittag-Leffler function is α = 0.96.

