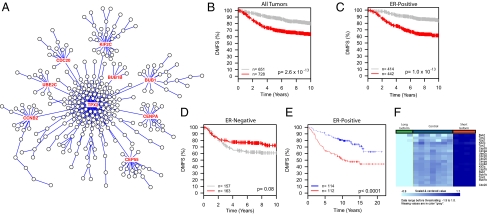
Fig. 2.
Analysis of the core TPX2 network. (A) The TPX2 network showing the positions of the nine node genes (red text) conserved among all five datasets. (B–D) Kaplan-Meier analysis of the TPX2 nine-gene signature on all tumors, (B) ER+ only, (C) ER− only, or (D) of the GOBO meta-analysis. (E) Analysis of the nine-gene TPX2 signature on the ER+ patients of the independent NKI dataset. Red curves in all plots represent patients with higher expression of the nine genes. (F) Heat map showing differential expression of the Tpx2 core genes in Mvt1 cells transfected with either the long or short isoform of Brd4.

