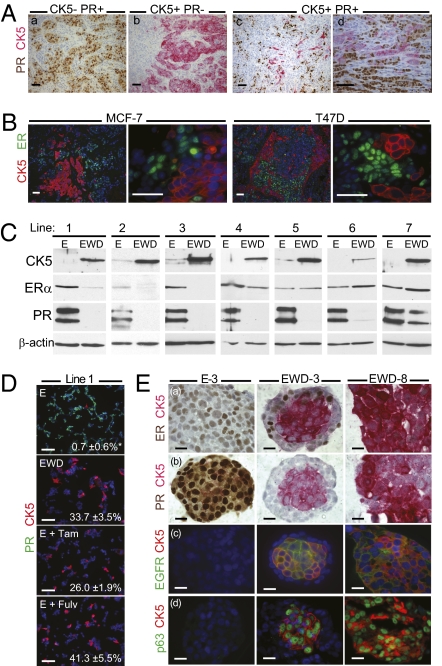
Fig. 1.
Luminobasal cells in clinical breast cancers and derivation of models with varying luminal/luminobasal ratios. (A) Primary tumors from 72 patients (14) were stained by IHC for CK5 (pink) and PR (brown). Four representative tumors are (a) pure luminal, (b) pure basal, and (c and d) mixed luminal/luminobasal. (Scale bars, 50 μm.) (B) CK5 (red) and ER (green) dual IHC in xenografts grown from MCF-7 or T47D luminal breast cancer cells. Cells (106) were injected into mammary glands of ovx'd mice supplemented with E. (Scale bars, 20 μm.) (C) Western blots of CK5, ER, and PRA or PRB isoforms in seven cell lines grown independently from T47D xenografts. Cells were cultured >45 d in 1 nM E or EWD media (Table S1). (D) Line 1 cells stained by ICC for CK5 (red) and PR (green) after culturing for >45 d in E or EWD media, or in E plus 100 nM Tam or Fulv. Percentage CK5+ luminobasal content is shown. *P < 0.01. (Scale bars, 20 μm.) (E) 3D colonies of lines E-3 (pure luminal), EWD-3 (mixed), and EWD-8 (pure luminobasal) were sectioned and stained by dual IHC for CK5 (pink) and luminal markers ER (a), PR (b, brown); or basal markers EGFR (c), p63 (d, green). (Scale bars, 20 μm.)

