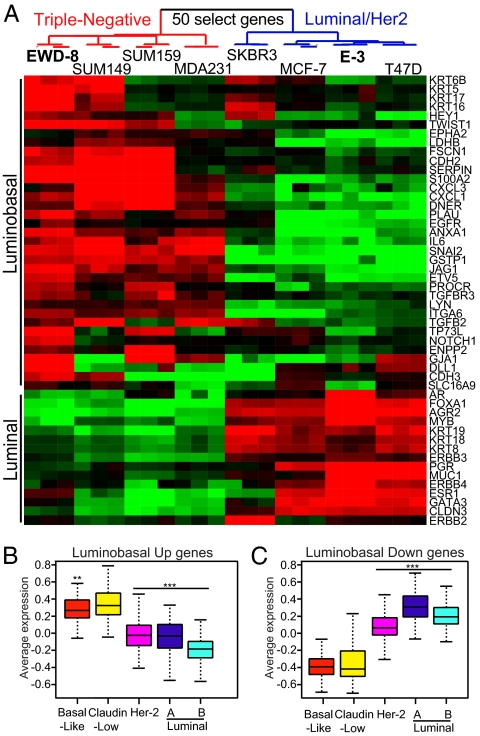
Fig. 2.
Despite their luminal derivation, luminobasal-rich EWD-8 cells cluster with TN cell lines and TN basal-like and claudin-low breast cancers. (A) Cluster analysis of 50 “luminobasal signature” genes up-regulated (red) or down-regulated (green) in EWD-8 cells compared with other breast cancer cell lines. (B and C) ANOVA box plots of the average gene expression values for 511 up-regulated (B) or 453 down-regulated (C) genes in the luminobasal signature, compared with genes in the 516 breast tumor dataset. Sixty-six percent of tumors fall within the interquartile range (IQR; colored box); the bar indicates the median value; whiskers show the range within subtype and are 1.5*IQR. **P < 0.001, ***P < 0.0001.

