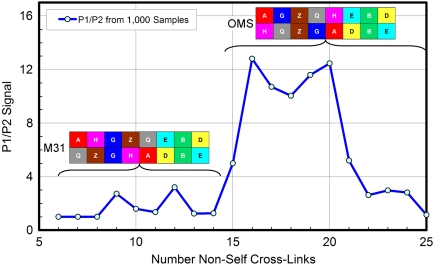
Fig. 6.
Showing the bootstrap P1/P2 score as a function of the cutoff threshold in the list of identified non-self cross-links. One thousand bootstrap samples were used for each data point. The arrangement most probable for a particular number of cross-links is illustrated; when P1/P2 = 1, several arrangements are equally probable.

