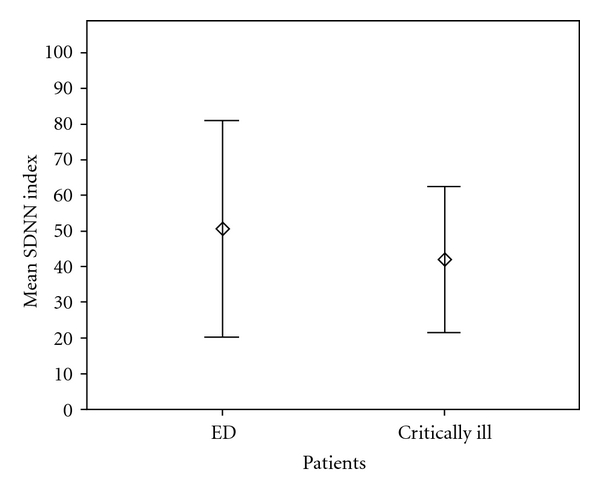
Figure 1.

Series Standard Deviation (Frequentist Statistics). SDNN index displayed as mean (circles) and 95% confidential interval (Bars). Healthy subjects showed a higher degree of dispersion around the mean (higher variability) compared to critically ill patients, P = 0.10 using Mann-Witney U-test. ED: Emergency Department.
