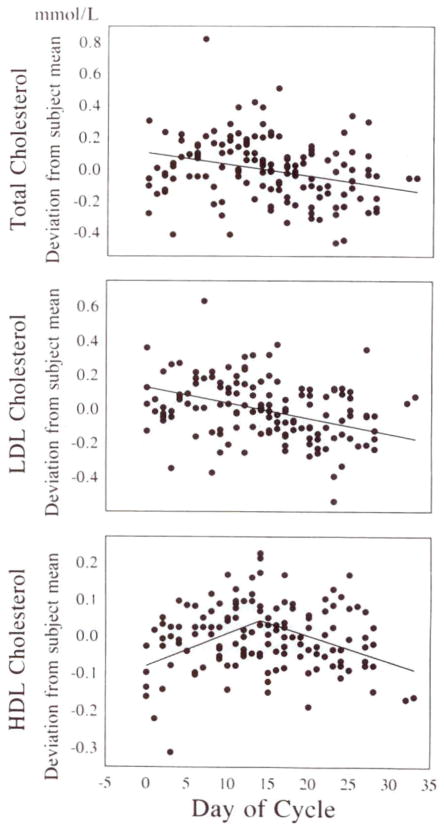
Fig 1.
Scatterplots showing plasma total cholesterol (top), LDL cholesterol (middle), and HDL cholesterol (bottom) concentrations during the menstrual cycle. Blood was obtained for plasma lipid determination from all women studied once a week during the final 3 weeks of each diet period. Data are plotted as deviations from each subject’s mean for one diet period; data from all three diet periods are plotted for each woman. Because menstrual cycle effects were similar during all three diets, data are combined in one plot. Total and LDL cholesterol levels fell by 0.051 mmol/L (P<.02) and 0.064 mmol/L per week (P<.001), respectively, during the menstrual cycle. HDL cholesterol concentrations rose by 0.060 mmol/L per week (P<.001) and fell by 0.050 mmol/L per week (P<.01) during the first and second halves of the cycle, respectively. Triglyceride levels were unaffected by the menstrual cycle (data not shown). To convert millimoles per liter cholesterol to milligrams per deciliter, multiply by 38.67.

