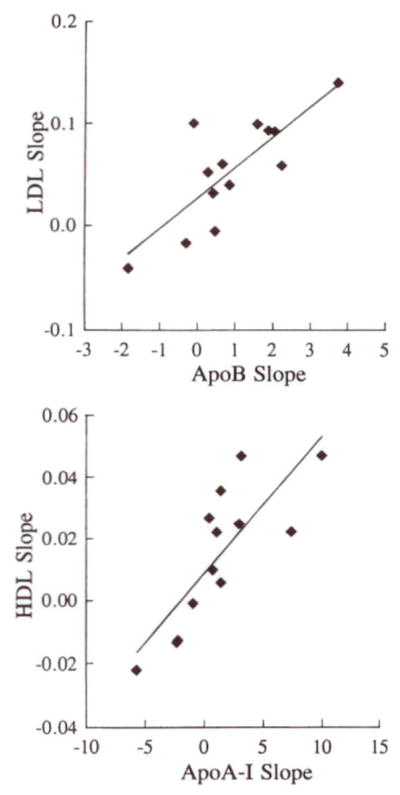
Fig 4.

Scatterplots showing correlations between LDL cholesterol and apolipoprotein (apo) B slopes (top, R=.80) and between HDL cholesterol and apoA-l slopes (bottom, R=.80). Each subject’s change in lipoprotein cholesterol between the 0- and 3-egg diets was related to the change in the appropriate apolipoprotein. The results suggest that increases in LDL and possibly HDL cholesterol levels were associated with increases in the number of particles in each lipoprotein class.
