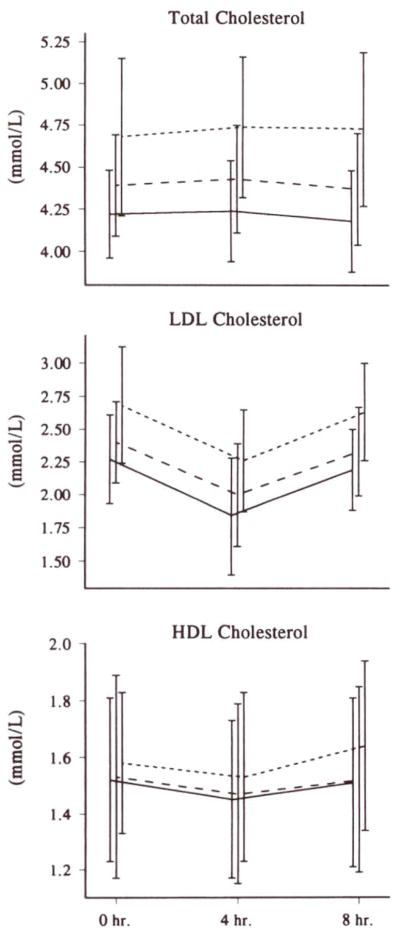
Fig 6.
Graphs showing post–fat formula plasma lipid responses to increases in dietary cholesterol. Total plasma (top), LDL (middle), and HDL (bottom) cholesterol levels were measured just before and 4 and 8 hours after subjects were fed a standard high-fat formula providing 53 g fat per meter squared, 60 000 U vitamin A per meter squared, and 300 mg cholesterol. This test was performed on all 13 subjects during each of the three diets. Lines represent the diets containing 0, 1, and 3 eggs per day, as shown in Fig 5. Although increases in dietary cholesterol intake had no effect on the response to this high-fat meal, after correcting for fasting levels (see Table 4), the absolute difference in the levels of cholesterol on the different egg intakes can be seen.

