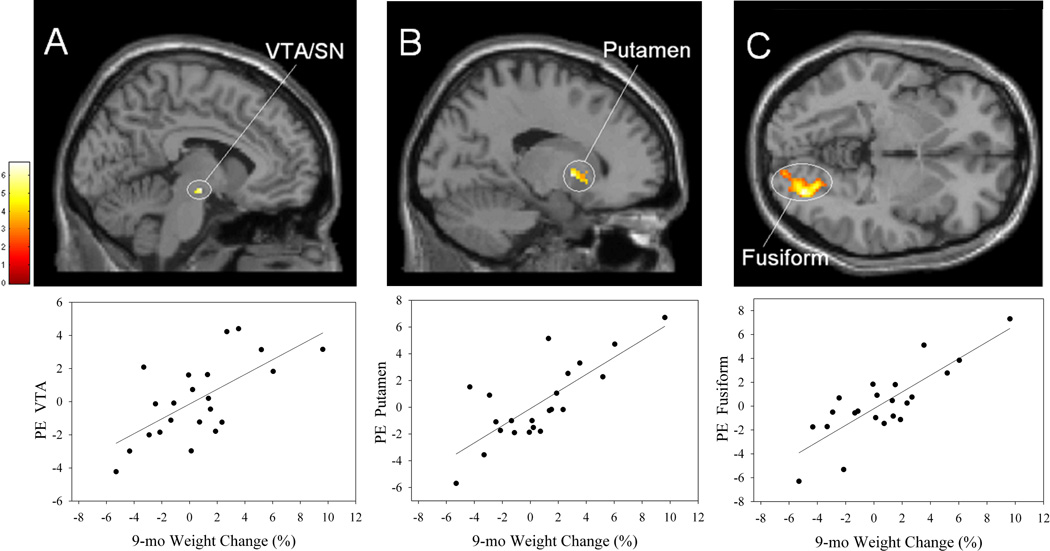
FIGURE 3.
Top row, brain areas showing significant positive correlations between percent 9-mo weight change following the EatRight Program and activation at session 2 to high-calorie food pictures > control pictures in the obese participants (n = 22) in the (A) ventral tegmental area/substantia nigra (VTA/SN), (B) putamen, and (C) fusiform gyrus. A and B identified from the reward ROI analyses, and C identified from the whole brain analyses. Bottom row, corresponding scatterplots (A, r = .66; B, r = .77; C, r = .82). Conventions as in Figure 2.

