
Figure 10.
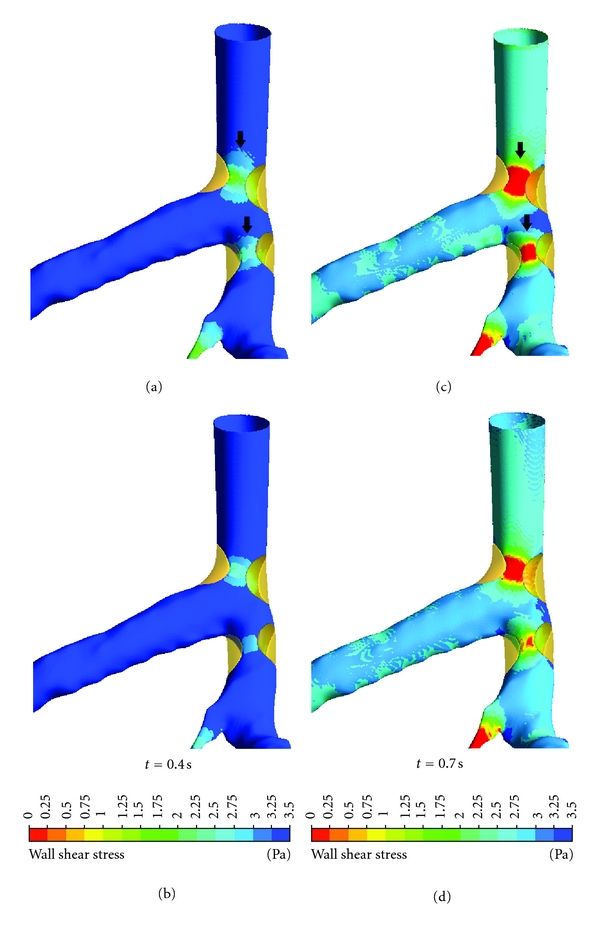
Comparison of WSS between non-Newtonian (a, c) and Newtonian (b, d) models observed in realistic coronary artery with presence of plaques during systolic peak of 0.4 s and middiastolic phase of 0.7 s. Arrows identify the different WSS at stenotic locations.