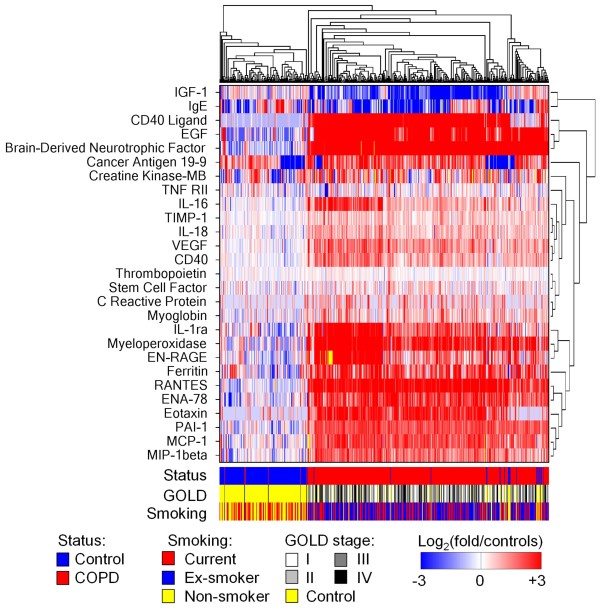
Figure 1.
Serum analytes associated with COPD vs controls. Hierarchical clustering (average linkage with Euclidean distances) was performed restricted to the analytes reported in Table 2 to be associated with COPD vs controls. Serum concentrations were normalized as log2 of fold over the geometric mean (Gm) of the control cohorts and presented as a heatmap with subjects across x-axis and analytes on y-axis. Disease status, smoking status, and GOLD stage are represented at bottom. IGF-1, insulin-like growth factor-1; Ig, immunoglobulin; EGF, epidermal growth factor; TNF-RII, tumor necrosis factor-receptor II; IL, interleukin; TIMP-1, tissue inhibitor of metalloproteinases-1; VEGF, vascular endothelial growth factor; EN-RAGE, extracellular newly identified-receptor for advanced glycation end-binding protein; RANTES, regulated upon activation, normally T-cell expressed, and secreted; ENA-78, epithelial-derived neutrophil activating protein-78; PAI-1, plasminogen activating factor-1; MCP-1, monocyte chemoattractant protein-1; MIP-1beta, macrophage inflammatory protein-1beta.

