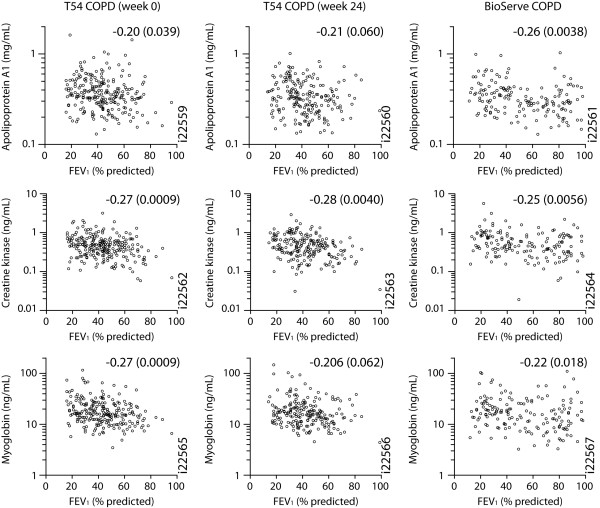
Figure 3.
Correlations of serum analyte concentrations and FEV1. Serum concentrations of the indicated analytes (y-axes) vs percent predicted FEV1 (x-axes) are plotted for the T54 COPD cohort at baseline week 0 visit (left) and week 24 visit (middle) and for the BioServe COPD cohort (right). Correlation coefficients and significance of correlations are reported for each plot.

