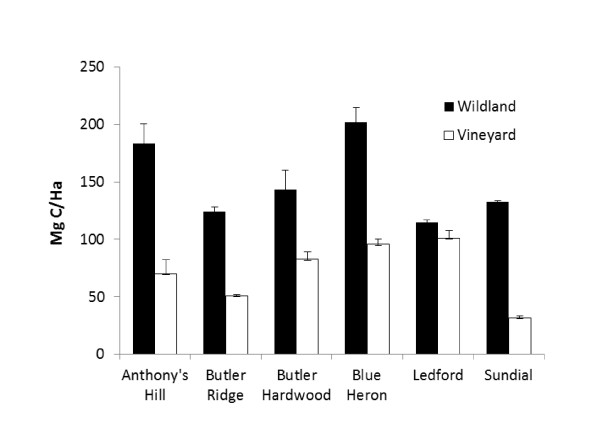
Figure 3.
Comparison of wildlands (dark bars) and vineyards (hollow bars) for carbon in the top meter of soil for paired (adjacent) soil pits at different locations across the study site (horizontal axis). Carbon values are extrapolated to per ha estimates. Error bars represent standard error based on four measurements per site.

