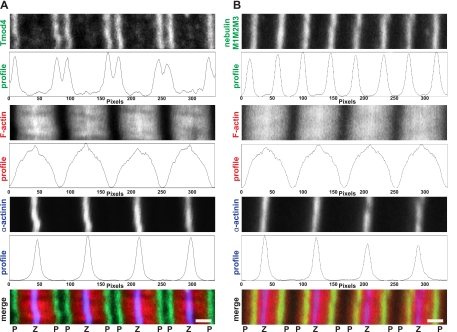
Fig. 2.
Line-scan analysis of fluorescence intensity of thin-filament components during distributed deconvolution (DDecon) analysis. Higher magnification views of the boxed myofibrils in Fig. 1 are shown. Longitudinal cryosections of pectoralis major muscle from patient 1 were immunostained for Tmod4 (A) or the nebulin M1M2M3 domain (B), phalloidin stained for F-actin, and immunostained for α-actinin to visualize Z-lines. Each probe's corresponding fluorescence intensity profile used for DDecon analysis is shown below each myofibril. Note that the nebulin M1M2M3 domain is localized more proximally with respect to the Z-line compared with Tmod4. Z, Z-line; P, thin-filament pointed end. Bars, 1 μm.

