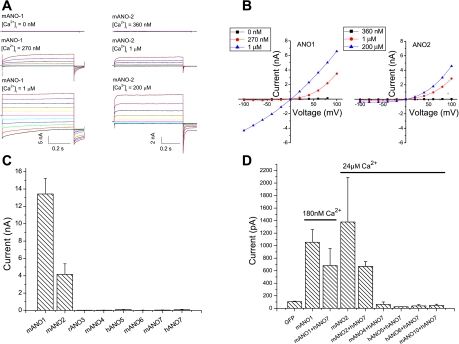
Fig. 1.
Anoctamin whole cell current response to intracellular [Ca2+]. A: representative current traces for mANO1 and mANO2 at different intracellular [Ca2+]. Different free [Ca2+] solutions were made by mixing the high Ca2+ solution with a Ca2+-free solution containing 5 mM EGTA (16). B: mean current-voltage (I-V) relationship for ANO1 and ANO2 in response to different intracellular [Ca2+]. C: current amplitude at +100 mV of mANO1, mANO2, rANO3, mANO4, mANO7, hANO5, mANO6, and hANO7 as indicated with an intracellular solution containing 5 mM Ca-EGTA (∼24 μM free Ca2+). N = 3–7 for each condition. D: current amplitude at +100 mV of hANO7 coexpressed with various ANOs as indicated in response to ∼24 μM intracellular [Ca2+] or ∼180 nM [Ca2+] for coexpression with ANO1. For transfection with individual ANO constructs, 1 μg DNA was used; cotransfections were performed using 0.5 μg of each ANO construct.

