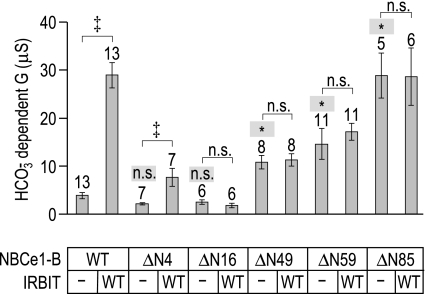
Fig. 6.
Localizing autoinhibitory and IRBIT-binding determinants within the NBCe1-B amino terminus. Bar chart summarizes the HCO3−-dependent slope conductances ± SE of oocytes expressing NBCe1-B/WT or truncated NBCe1-B constructs (NBCe1-B/ΔN4 to NBCe1-B/ΔN85), with or without WT-IRBIT. The number of replicates in each group is displayed above each bar, together with a note of statistical difference (* on a shaded background) or nonsignificance (n.s. on a shaded background) from WT NBCe1-B (P < 0.05, ANOVA on samples without IRBIT with Tukey's post hoc analysis). Also provided is a note of significance (‡) or of nonsignificance (n.s.) between specific pairs of interest (indicated by a horizontal bracket), as assessed by t-test.

