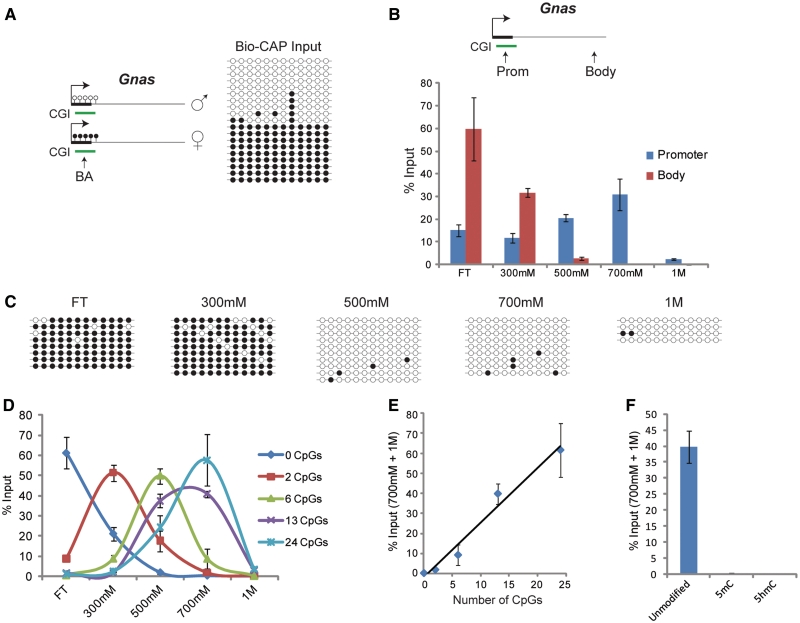
Figure 3.
Bio-CAP is sensitive to the methylation status and density of CpG dinucleotides. (A) A schematic of the imprinted Gnas gene, which has a CGI promoter that is methylated on the maternal allele but non-methylated on the paternal allele (left panel). Using the indicated bisulfite PCR amplicon (BA), this imprinting was confirmed in the mouse ES cells used for Bio-CAP (right panel). Empty and filled circles represent non-methylated and methylated CpG dinucleotides, respectively. (B) qPCR analysis of Gnas promoter and body regions in Bio-CAP. A schematic of Gnas indicating the position of primer sets and a CGI from in silico prediction is shown above the data set. (C) Using the same amplicon (BA) shown in (A), bisulfite sequencing was performed on each of the fractions from a Bio-CAP experiment. (D) A Bio-CAP experiment with mouse ES cell DNA was spiked with a panel of human-specific 200 bp probes each containing a known number of CpGs. Using qPCR analysis, Bio-CAP fractions were assayed for the presence of each probe. (E) Scatter graph showing relationship between number of CpGs and % input recovery in high-salt fractions (700 mM + 1 M) of Bio-CAP spiking experiment shown in (D). A line of best fit is shown. (F) A Bio-CAP experiment with mouse ES cell DNA was spiked with a 200 bp human probe containing 13 CpGs that were either unmodified, methylated (5mC) or hydroxymethylated (5hmC). Using qPCR analysis, Bio-CAP high-salt fractions (700 mM + 1 M) were assayed for the presence of each of probe variant. All Bio-CAP data are from at least two biological replicates and error bars represent SEM.

