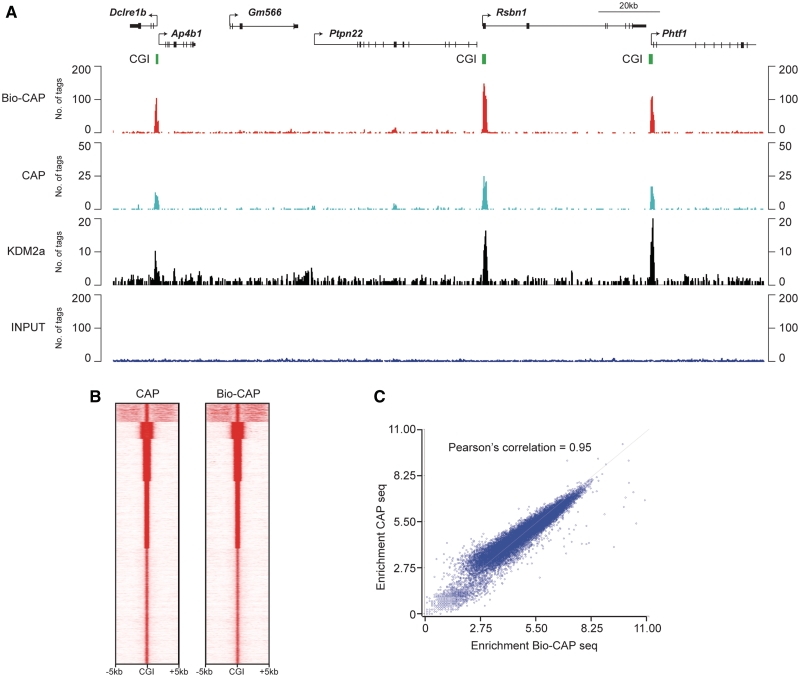
Figure 5.
Bio-CAP followed by massively parallel sequencing reveals non-methylated CGIs genome wide. (A) The high-salt fraction (700 mM + 1 M) from a Bio-CAP experiment with mouse sperm genomic DNA was subjected to massively parallel sequencing and sequencing reads were aligned back to the mouse genome. Bio-CAP sequencing analysis is shown (top panel, red) for an ∼180 kb region of chromosome 3 (chr3: 103 598 131–103 782 151), with comparative analysis from conventional CAP sequencing (second panel, light blue), KDM2A ChIP sequencing in mouse ES cells (third panel, black) and input material (bottom panel, dark blue). Annotated genes in this region are illustrated above the sequencing traces, with arrows indicating transcription start sites and CGIs from in silico predictions indicated in green. (B) Heat map comparing CAP-seq and Bio-CAP-seq data sets centered at CGIs including 5 kb windows upstream and downstream. (C) Bio-CAP-seq enrichment plotted against CAP-seq enrichment for all CGIs genome wide, illustrating the extremely high correlation between Bio-CAP-seq and CAP-seq.

