
Table 6.
Estimated and observed frequencies (%) in the cWW/cHW triple family
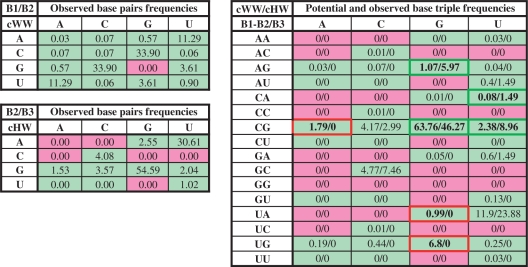 |
The left panel shows the observed frequencies of base combinations in the cWW and cHW base pair families; green and pink background colors indicate base pairs that occur or do not occur, respectively, in the corresponding base pair families. The right panel shows the estimated and observed frequencies for base triples in the cWW/cHW family. Estimated frequencies for each triple combination (first number in each cell) were calculated by multiplying the observed frequencies of the component cWW and cHW base pair combinations and normalizing. Observed frequencies are obtained by normalizing occurrences of cWW/cHW base triples in the NR data set. Green outline and bold font indicates base combinations with high or higher than estimated occurrence frequencies (e.g. CGG) and red outline and bold font indicates those with significantly lower than estimated frequencies (e.g. UGG). As shown in Figure 4, CGG is stabilized by favorable interactions between bases 1 and 3 of the triple, while UGG is destabilized by clashes between bases 1 and 3. Estimated and observed frequencies for all triple families are given in Supplementary Data S3.