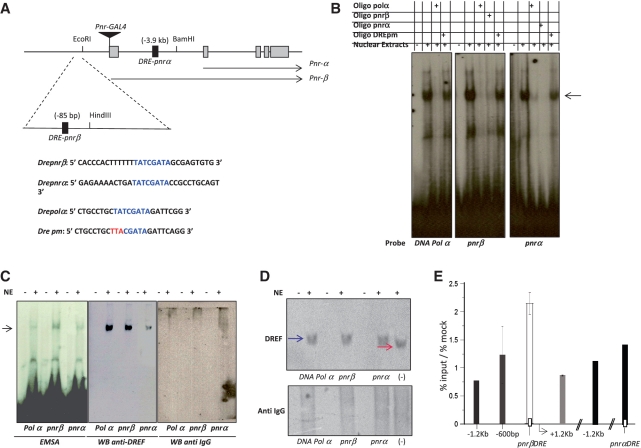
Figure 3.
DREF binds to two DRE elements in the pnr control region. (A) Localization of the two DRE (Dre-pnrα and Dre-pnrβ) consensus sequences near the transcription initiation site of the pnr-β (−85 bp) and pnr-α (−3.9 kb) transcripts. The sequence of the two Dre pnr elements, the Dre-polα and a mutant form (DRE pm) used as positive and negative controls respectively are also shown. The insertion site of the pnr-Gal4 driver is also indicated. (B) EMSA analysis of the DRE elements found in the pnr-β and α control region. P32-labeled double-strand oligonucleotides with the sequences indicated in the panel A were incubated with Drosophila nuclear extracts with or without competing non-labeled oligonucleotides (100-fold molar excess of the same and the mutant non-radioactive oligonucleotides). The arrow shows the shifted complex. (C) EMSA-western blot used to identify the presence of DREF in the shifted complexes. In the left panel a typical EMSA is observed after the incubation of nuclear extracts with the Dre-Polα, Dre-pnrα and Dre-pnrβ oligonucleotides. The central panel shows a western blot using an anti-DREF antibody after the transfer of the EMSA to a nitrocellulose membrane. The right panel shows a western blot after the transfer of the DRE-protein complexes, but using a not related antibody as a control. (D) Native DREF is shifted in the presence of the DRE oligonucleotides. Western blots are shown after the transfer of total nuclear proteins previously incubated with the DRE oligonucleotides and separated in a native polyacrilamide gel. Note that in the presence of the different DRE oligonucleotides the band recognized by the DREF antibody is shifted when compared to the one without DNA indicated as (−). A control western blot using an unrelated antibody is also shown. (E) ChIP assays using a specific antibody against DREF to determine the distribution DREF factor around and on the putative pnr-α and pnr-βDRE in chromatin derived from embryos. Graphs show results from three independent immunoprecipitation reactions (n = 3). ChIP signals quantified by means of quantitative polymerase chain reaction, are presented as percentage of the input/percentage of the mock antibody. As it can be observed in the figure, the pnr-β chromatin region shows the maximum enrichment when the precipitation was carried out with the DREF antibody.

