Figure 4.
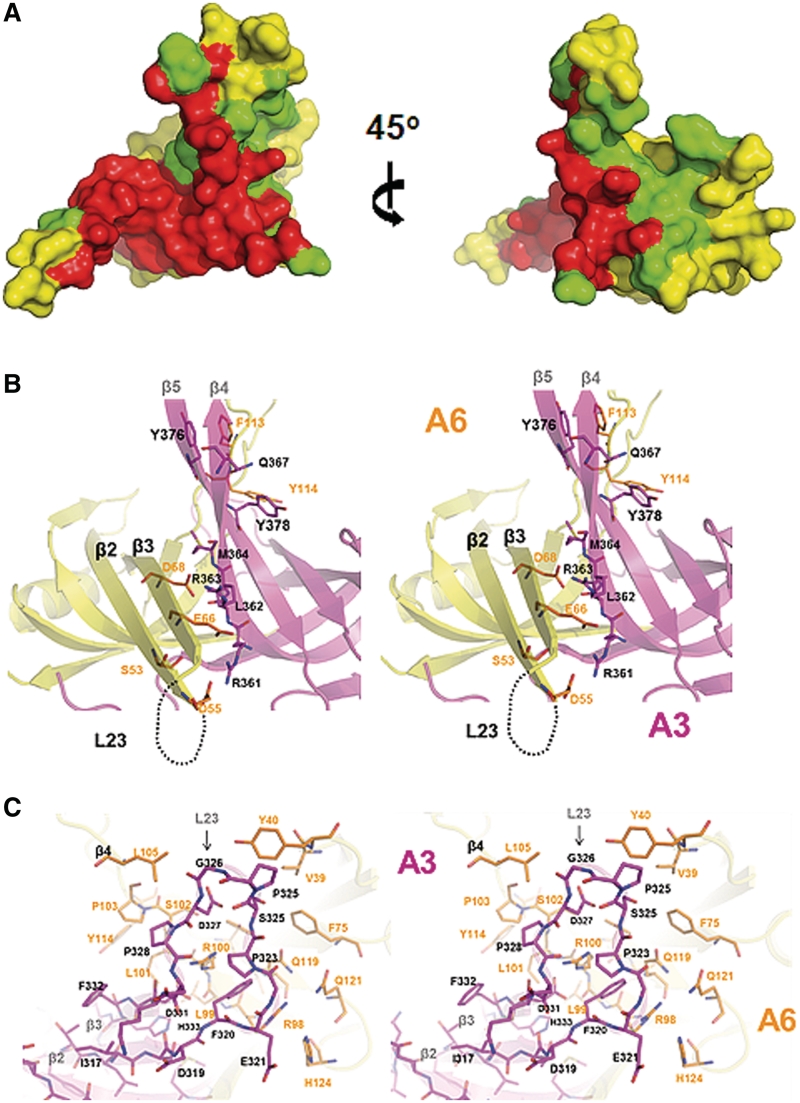
Interactions in A3OB–A6 compared with those in A6–A6. (A) The fingerprint of A3OB on A6 is larger than that of A6 on A6. The interactions are ‘painted’ onto the surface of A6. Red: the contact area which is the same in the A3OB–A6 heterodimer and in the A6 homodimer. Green: the extra contact area in the heterodimer compared with the homodimer. Yellow: the surface of A6 neither in contact with A3OB in the heterodimer, nor with the second A6 subunit in the homodimer. The surface buried in the interaction in A3OB–A6 is ∼35% larger than in the A6–A6 dimer (PDB-ID: 3K7U)(54). (B) Strands β2–β3 of A6 contacting A3OB. A stereo view of the ‘second contact area’ (see text) of A3–A6 with important residues highlighted shown in ribbon representation with the same color coding as in Figure 1B. The secondary structure elements and key residues mediating the A3–A6 dimer interactions are labeled. (C) The Pro-rich L23 loop of A3OB contacting A6. A stereo view, 180° different about the vertical axis from (B), of the ‘third contact area’ (see text) in the heterodimer shown with stick representations. Selected secondary structure elements and key contact residues are labeled. A3 is colored magenta, A6 yellow-gold.

