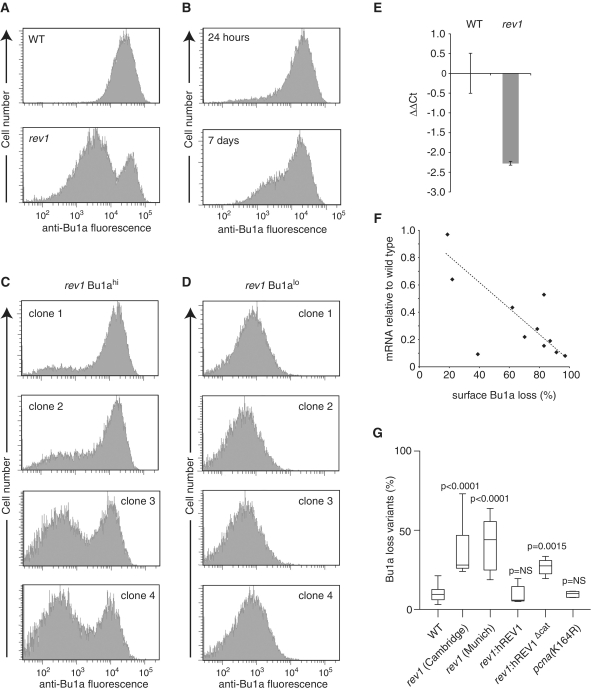
Figure 3.
Stochastic loss of surface Bu-1a in rev1-deficient cells. (A) A high-passage culture of rev1 cells exhibits a substantial population of Bu1a-loss variants. Flow cytometry histogram showing staining of WT and rev1 bulk populations with anti-Bu1a. (B) Constitutive loss of Bu1a from a Bu1a-positive population of rev1 cells. rev1 cells were enriched to >99% Bu1a positive by flow sorting and the population monitored for Bu1a loss at 24 h and 7 days. (C) Stochastic loss of Bu1a in Bu1a-positive subclones. Clones were expanded for 3 weeks before analysis by flow cytometry. (D) Bu1a loss is a stable phenotype. Expression of Bu1a in selected Bu1a-loss variant clones expanded for 3 weeks. (E) Reduction in Bu1a transcript in rev1 cells. qRT-PCR for Bu1a mRNA. Error bars show standard deviation. P = 0.05 (2-tailed T-test). (F) Loss of surface expression of Bu1a correlates with decreased mRNA. mRNA level in individual rev1 clones (WT = 1) assessed by qRT-PCR plotted against the percentage of cells showing negative surface Bu1a expression. (G) Complementation of the constitutive loss of Bu1a in rev1 cells by expression of full length, but not catalytically inactive hREV1. Individual Bu1a-positive subclones of each indicated genotype were expanded for 3 weeks and assessed for Bu1a loss by flow cytometry. rev1(Cambridge) and rev1(Munich) are two independently generated rev1 lines (Table S1). For each condition the graph shows the median (central line), range (whiskers) and interquartile range (boxes). The probability (Mann–Whitney U-test) that the distribution of loss is the same as WT is shown. NS = not significantly different. P for the difference between rev1:hREV1 and rev1:hREV1Δcat = 0.0104.

