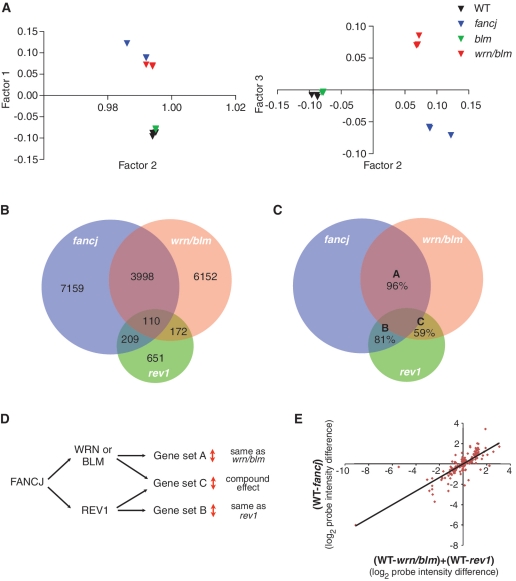
Figure 6.
Two pathways for the maintenance of epigenetic stability at G-quadruplex forming DNA sequences. (A) PCA on microarray probes from three independently growing fancj, wrn/blm, blm and WT DT40 lines. PCA is a statistical method for explaining a complex data set in a minimum number of factors, or principal components. In this case, three orthogonal factors were sufficient to explain >98% of the variation within the data set. (B) Venn diagram showing the number of probes statistically significantly perturbed (P < 0.05) with a >0.25 log units difference to WT DT40 in rev1, fancj and wrn/blm mutants, and the overlap between these sets. All overlaps are statistically significant (see text). (C) Venn diagram as in Figure 7C showing the percentage of probes, within each set, which show the same direction of change in each pair of mutants. The expected codirectionality assuming independence between the conditions is ∼50% for each set. (D) Hypothetical relationship between FANCJ, WRN or BLM and REV1 in maintaining epigenetic stability. Sets A, B and C refer to the pairwise overlaps between the mutants shown in Figure 6C. (E) Changes in probe intensity in the fancj mutant for probes overlapping with rev1 and wrn/blm. Log2 change in fancj is plotted against the sum of the log2 change in rev1 and the log2 change in wrn/blm. The regression line is indicated (R = 0.82).

