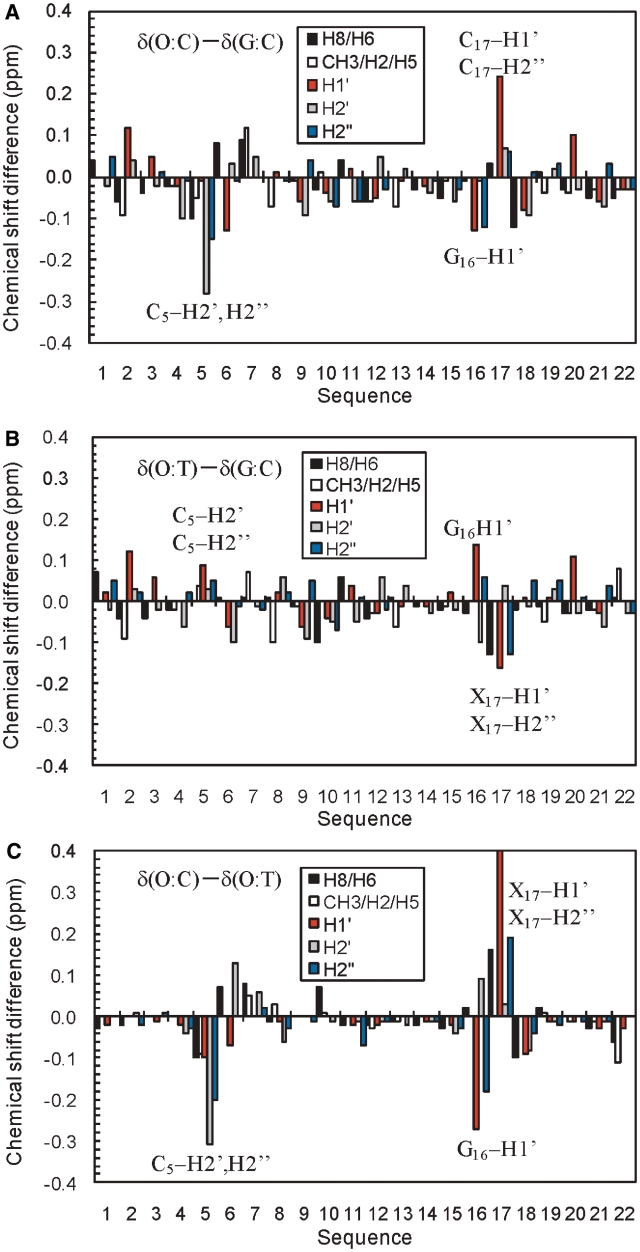
Figure 4.
1H chemical shift differences between the DNA duplexes for H8/H6 (black), T CH3/A H2/C H5 (white), H1′ (red), H2′ (gray), H2′′ (blue): (A) δ(O:C duplex) – δ(G:C duplex), (B) δ(O:T duplex) – δ(G:C duplex), (C) δ(O:C duplex) – δ(O:T duplex). The protons which showed the large differences between the O:C and O:T duplexes are indicated by the names and sequential numbers.

