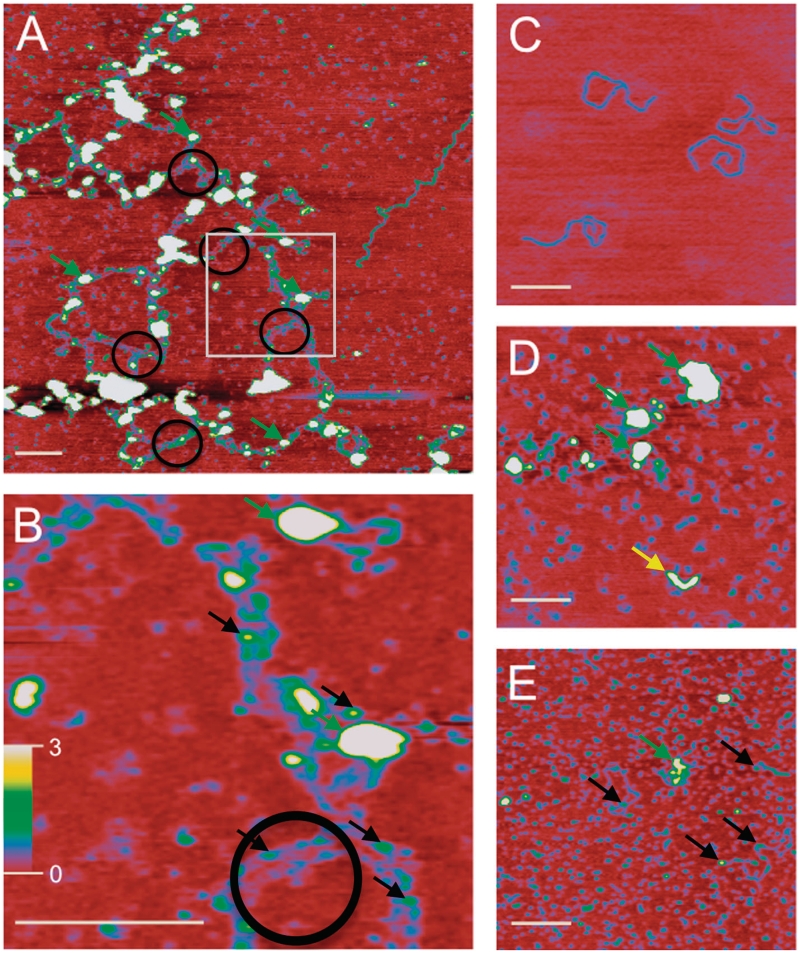
Figure 3.
SFM analysis of protein–DNA networks. (A) Large protein–DNA networks observed in XRCC4–XLF DNA-binding reactions. Nucleoprotein complexes appear as higher wider objects (∼30–60 Å high and 400–800 Å wide, green arrows). Such complexes were typical and observed on all 16 of the 2 × 2 micron images collected for this sample. Protein-induced parallel bridging of DNA molecules is evident (black circles) and occurs in many places along the long complex. Extended DNA networks indicate DNA molecules are positioned end-to-end. White box indicates area enlarged in (B). (B) Enlargement of (A) highlighting parallel DNA molecules. Spacing between parallel DNA molecules is ∼200 Å. Smaller nucleoprotein complexes, measuring 4–7 Å high and 110–180 Å wide, are also evident (Figure 3B, black arrows). (C) The 1.8-kb linear DNA, contour length 6000 Å, width 180 Å and height 2 Å. (D) Image of XRCC4–XLF complexes in absence of DNA. Small protein complexes, likely dimers, tetramers and small multimers, appear as blue uniform objects distributed over the surface. Larger protein complexes (30–60 Å high and 400–800 Å wide) and elongated forms were also present and are indicated by green and yellow arrows, respectively. Elongated structures (yellow arrow) measuring ∼1300 Å long, 20–25 Å high and 300 Å wide, were observed with a frequency of approximately one for every 2 × 2 micron image inspected. (E) Addition of DNA Ligase IV BRCT domains disrupts nucleoprotein networks. Smaller protein complexes similar to (D) are uniformly distributed and appear as small blue objects. DNA molecules associated with protein complexes are also observed (25–60 Å high and 400–800 Å wide, green arrow) with a frequency of approximately one for every 2 × 2 micron image inspected. Smaller nucleoprotein complexes (4–7 Å high and 110–180 Å wide, black arrows) were observed at higher frequency. (A) is 2 × 2 microns. (B) is 500 × 500 nm. (C–E) are 1 × 1 microns. In all images the white bar is 2000 Å long and height is indicated by color (0–3 nm red to yellow/white, scale bar in panel B). Note that biomolecule dimensions are distorted in SFM images. X–Y dimensions increase due to tip convolution and Z (height) decreases relative to tip surface and tip molecule interactions. For instance DNA, that is 20 Å wide and 20 Å high based on crystal structure of B-form, typically measures 200 Å wide and 2–5 Å high in our SFM images. Relative size and separation between objects can be used very accurately.

