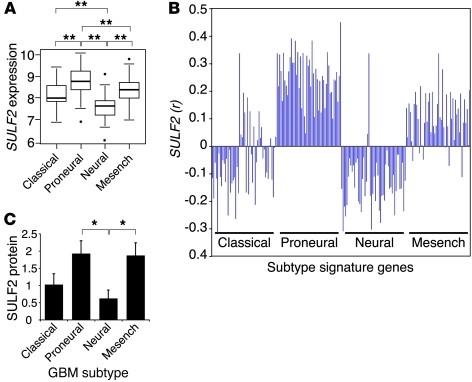
Figure 9. SULF2 expression is associated with the proneural GBM subtype.
(A) SULF2 expression by human GBM subtype. Box plots show the median (range) normalized SULF2 expression levels were 8.1 (6.9–9.5), 8.9 (7.0–10.2), 7.8 (6.6–9.2), and 8.5 (7.1–9.9) for the classical, proneural, neural, and mesenchymal (mesench) subtypes, respectively (n = 173 tumors); **P < 0.005. The values within the box represent the lower quartile (Q1), median, and the upper quartile (Q3) of the distribution. The horizontal bars at the 2 ends are the smallest and largest nonoutlier observations. The circles beyond the horizontal bars represent outlying cases, defined as 1.5 times the interquartile range (Q3–Q1), below Q1 or above Q3. (B) Similarity (Pearson correlation, r) between SULF2 expression and the expression of 50 genes characterized as signature genes for each of the previously defined GBM subtypes (8). A positive coefficient denotes a positive relationship between SULF2 expression and expression of the gene of interest on the x axis (n = 202 tumors). In silico analysis for A and B was performed on expression data from the TCGA Data Portal. (C) SULF2 protein expression in primary human GBM samples of different subtypes. Tissue microarrays of previously subtyped human tumors were immunostained for SULF2 and scored. Data are represented as mean ± SEM for the classical, proneural, neural, and mesenchymal GBM subtypes, respectively (n = 28 tumors total). *P < 0.05.

