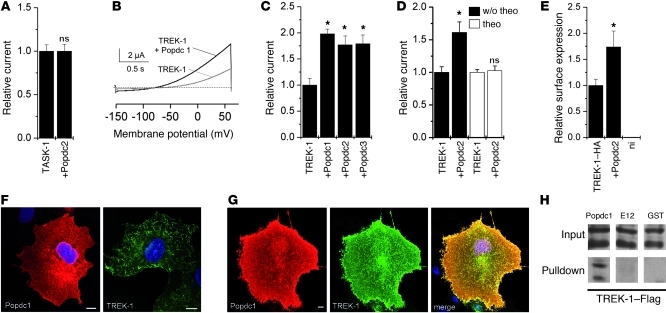
Figure 5. Interaction of Popdc proteins with the 2-pore channel TREK-1.
(A) Relative current amplitudes of TASK-1 alone or in the presence of Popdc2 were assayed in Xenopus oocytes 48–72 hours after injection (n = 28–31). Error bars in A and C–E are SEM. (B) Example of the measurement of TREK-1–mediated outward current after injection of TREK-1 cRNA alone (gray curve) or in the presence of Popdc1 (black curve) in Xenopus oocytes. (C) Relative current amplitudes of TREK-1 alone or in the presence of Popdc1, Popdc2, or Popdc3 (n = 14–22). *P < 0.05. (D) Relative TREK-1 current amplitudes in the presence or absence of Popdc2. The oocytes were incubated for 48 hours with or without theophylline (n = 17–32). *P < 0.05. (E) Quantification of the relative surface expression of HA-tagged rat TREK-1b in the presence or absence of mouse Popdc2 (n = 27 and 19, respectively). ni, noninjected control oocytes (n = 12). *P < 0.05. (F and G) Immunostaining of Popdc1 (red) or TREK-1 (green) transfected individually (F) or both together (G) into Cos-7 cells. Nuclei were counterstained with DAPI. Scale bars: 10 μm. (H) Example of a GST pulldown experiment using the C terminus of Popdc1 fused to GST and Flag-tagged human TREK-1. GST-E12 and GST proteins were used as controls.

