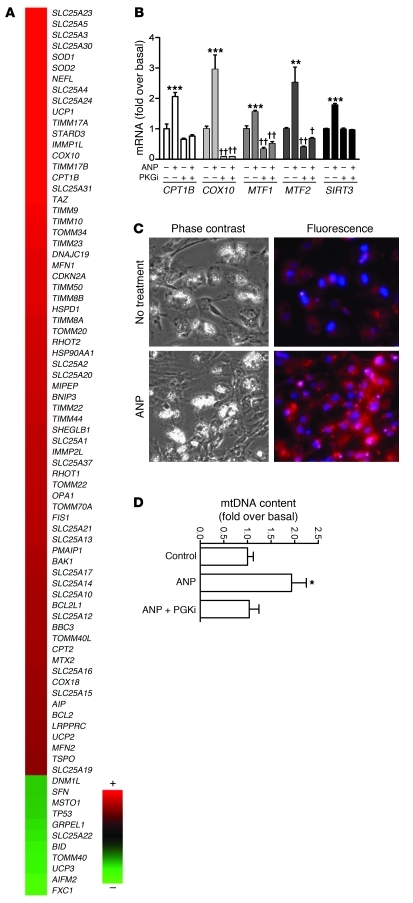
Figure 5. ANP promotes mitochondrial biogenesis in human adipocytes.
(A) Heat map of mitochondrial PCR array results from hMADS adipocytes that were treated or not with 100 nM ANP for 6 hours. The range of fold change versus basal was 3.1 to –1.4. (B) Validation of response to ANP and effect of PKGi on select genes from PCR array data. SIRT3 was also measured. **P < 0.01, ***P < 0.001 for ANP versus untreated cells; †P < 0.05, ††P < 0.01 PKGi versus untreated control. (C) Phase-contrast and MitoTracker fluorescence images of hMADS cells that were treated or not with 100 nM ANP, as described in Methods. Mitotracker is identified by the orange-red color. DAPI-stained nuclei are blue (original magnification, ×20). (D) mtDNA content was quantified by qPCR, as described in Methods. Bars represent mean ± SEM. *P < 0.05 compared with control.

