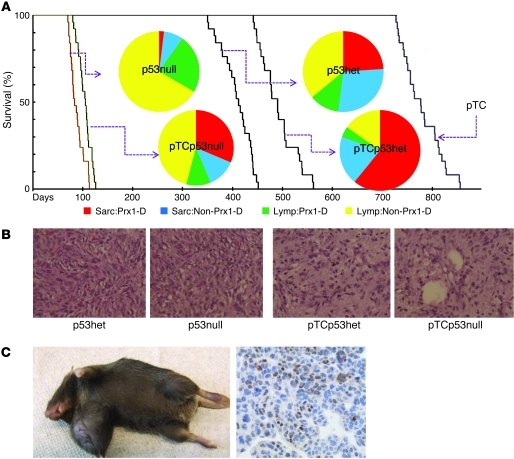
Figure 2. pTCp53null mice give rise to sarcomas.
(A) Survival curve of p53null, pTCp53null, p53het, pTCp53het, and pTC mice (n = 25 per group). Inset pie charts show histopathology occurrence and distribution. Sarc:Prx1-D, sarcoma with Prx1 distribution; Sarc:Non-Prx1-D, sarcoma with non-Prx1 distribution; Lymp:Prx1-D, lymphoma with Prx1 distribution; Lymp:Non-Prx1-D, lymphoma with non-Prx1 distribution. (B) Histopathology (H&E) of sarcomas from p53null, pTCp53null, p53het, and pTCp53het mice. Original magnification, ×100. (C) Gross demonstration of pTCp53null mouse forming a sarcoma and IHC expression of TLS:CHOP. Original magnification, ×200.

