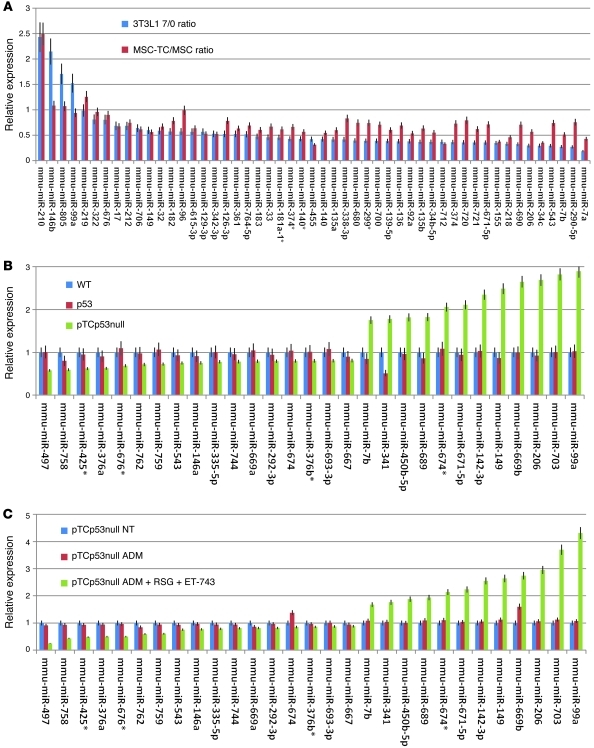
Figure 5. MicroRNA patterns in TLS:CHOP tumors relate to differentiation stage.
(A) MicroRNA expression, shown as the ratio of expression in 3T3L1 cells after 7 days relative to before differentiation (3T3L1 7/0 ratio; blue) compared with the ratio of expression in pTCp53 relative to WT MSCs (MSC-TC/MSC ratio; red). (B and C) microRNA expression of an adipocyte-specific differentiation microRNA panel in WT bone marrow–derived MSCs and p53null and pTCp53null sarcomas (B) or in pTCp53null mice left untreated or treated for 22 days with ADM or with the combination of ADM, RSG, and ET-743 (C), expressed relative to respective WT or untreated control. Values in A–C denote average of 3 replicate experiments (see Methods).

