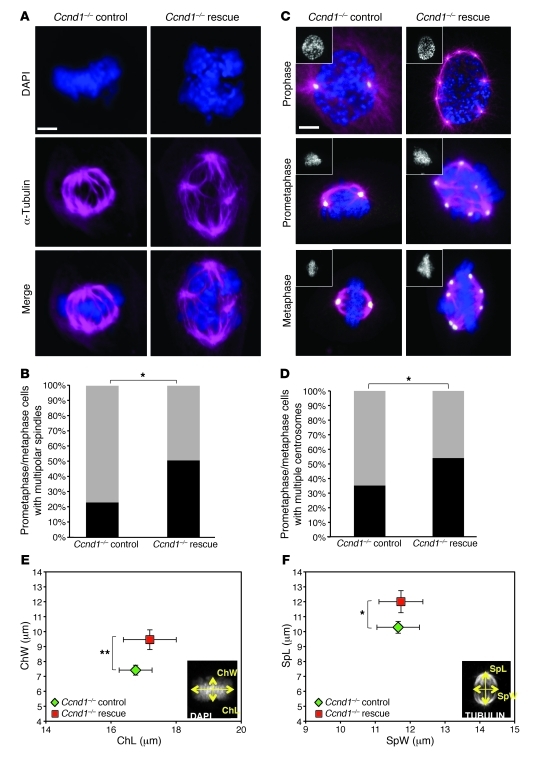
Figure 4. Cyclin D1 induces centrosome amplification and mitotic spindle disorganization.
(A and C) Representative confocal maximum Z projections of mitotic cells (A; immunostained for α-tubulin [violet] and DAPI [blue]) and prophase, prometaphase, and metaphases (C; immunostained for α-tubulin [violet], γ-tubulin [yellow], and DAPI [blue and insets]) from control and cyclin D1–rescued Ccnd1–/– cells. Original magnification, ×60 NA1.4 oil objective, enlarged ×5 by digital zoom. Scale bars: 5 μm. (B and D) Frequency of mitotic cells with multiple polar spindles (B) and of prometaphase/metaphase cells with multiple centrosomes (γ-tubulin) and spindle disorganization (α-tubulin) (D). *P = 0.0289, χ2 analysis. Black bar, abnormal centrosome count (i.e., >2); gray bar, normal count (i.e., 2). (E and F) Spindle measurements on maximum Z projections of metaphase control and cyclin D1–rescued Ccnd1–/– cells. Data are mean ± SEM. Insets demonstrate metaphase plate (i.e., chromatin; Ch) width and length (measured using DAPI stain) and spindle (Sp) width and length (measured using tubulin stain). *P = 0.0486; **P = 0.0087.

