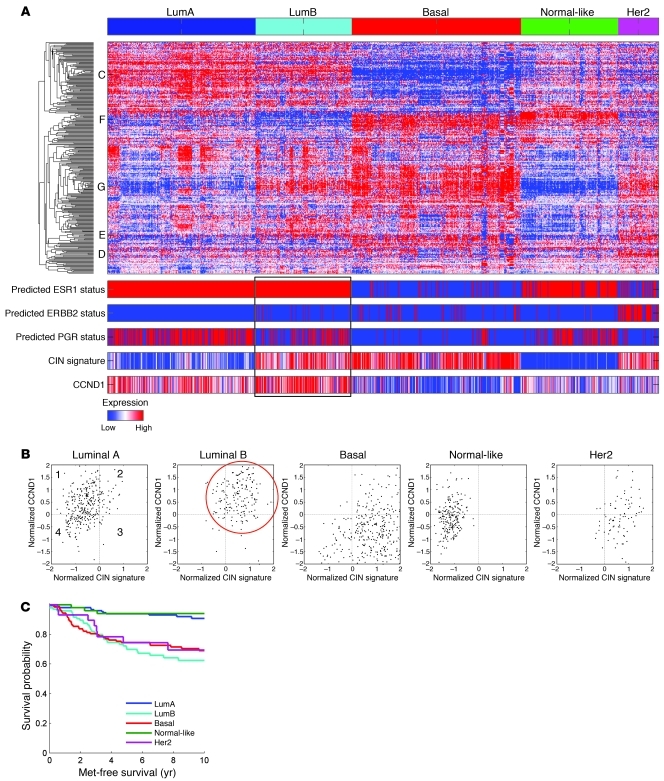
Figure 6. Subtype classification of breast cancer microarray samples.
(A) Heatmap depicting samples from combined breast cancer microarray datasets that were assigned to the 5 breast cancer gene expression subtypes. The predicted ESR1, epidermal growth factor receptor (ERBB2), and progesterone receptor (PGR) statuses are shown together with CIN signature score and CCND1 expression level across the 5 subtypes. The luminal B subtype receptor status, CIN signature score, and cyclin D1 expression level is outlined. (B) CCND1 transcript level plotted versus average CIN signature expression level revealed that the relationship between high CIN score and high cyclin D1 expression was luminal B subtype specific (red circle). (C) Kaplan-Meier plot showing differences in metastasis-free status in this dataset (P = 6.4462 × 10⁻⁸).

