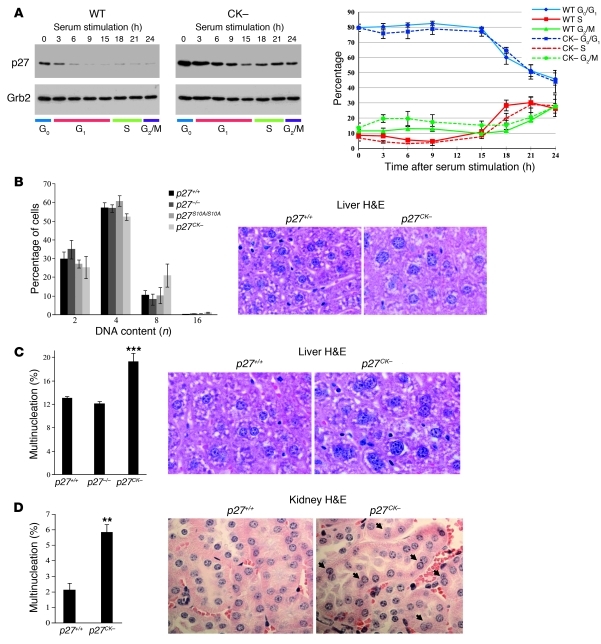
Figure 1. Polyploidy and multinucleation in the liver and kidney of p27CK– mice.
(A) p27 and p27CK– expression during the cell cycle. Primary MEFs (passage 2) derived from p27+/+ and p27CK– mice were serum starved for 72 hours in DMEM/0.1% serum and replated in 10% serum medium for the indicated time. Proteins (40 μg) were resolved on SDS-PAGE, and membranes were probed with anti-p27 (C19) antibody; Grb2 levels were used as loading control. The graph shows the corresponding flow cytometry analysis of propidium iodide–stained serum-stimulated MEFs (average of 3 independent experiments ± SEM). (B) Analysis of hepatocyte DNA content of Feulgen-stained liver sections in p27+/+ (n = 11), p27–/– (n = 5), p27CK– (n = 8), and p27S10A/S10A (n = 4) mice. Error bars represent SD. Examples of p27+/+ and p27CK– H&E-stained liver sections illustrating nuclear size (original magnification, ×1,000). (C) Multinucleated cells were counted on 3-μm-thick sections stained with β-catenin or H&E in a total of 1,000 hepatocytes from at least 3 different mice per genotype. The results were analyzed using 1-way ANOVA with the Tukey-Kramer multiple comparison test; ***P < 0.001. Examples of p27+/+ and p27CK– H&E-stained liver sections illustrating multinucleation are shown (original magnification, ×1,000). (D) The percentage of multinucleated cells in kidney sections of p27+/+ (n = 4) and p27CK– (n = 5) mice was determined. For each animal, 250–500 cells were counted. **P < 0.01, Mann-Whitney U test. Examples of p27+/+ and p27CK– H&E-stained kidney sections illustrating multinucleation are shown (arrows) (original magnification, ×600). Error bars in C and D represent SEM.

