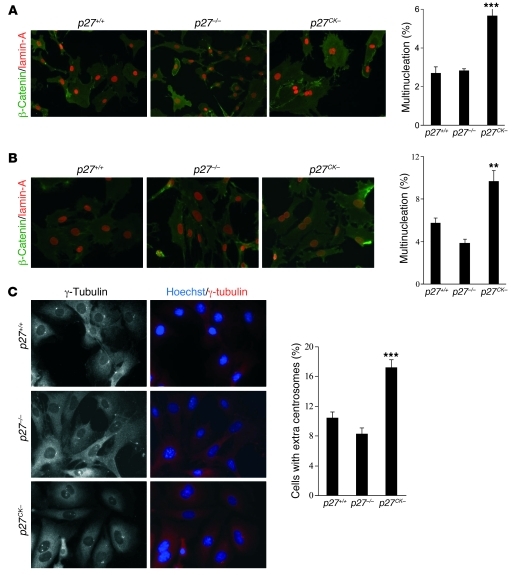
Figure 2. Multinucleation and centrosome amplification in p27CK– MEFs.
(A) Primary MEFs (passages 2–3) derived from p27+/+, p27–/–, and p27CK– mice were stained with anti–β-catenin and anti–lamin-A antibodies to visualize plasma membrane and nuclear envelope, respectively (original magnification, ×400). For each experiment, 500 cells were counted per genotype. The graph shows the mean of 3 independent experiments. Results were analyzed by 1-way ANOVA with the Tukey-Kramer multiple comparison test. p27+/+ versus p27CK–, ***P < 0.001. (B) The number of nuclei per cell was counted in two lines of immortalized MEFs per genotype. Cells were stained as in A, and 500 cells per line were counted (original magnification, ×400). The graph shows the average of 4 independent experiments. Statistical analyses were performed as in A. p27+/+ versus p27CK–, **P < 0.01. (C) Centrosomes were visualized by γ-tubulin staining and counted in 300 cells per genotype (original magnification, ×600). Graph shows the average of 2 different MEF lines per genotype in 4 independent experiments. Statistical analyses were performed as in A; p27+/+ versus p27CK–, ***P < 0.001. Error bars in A–C represent SEM.

