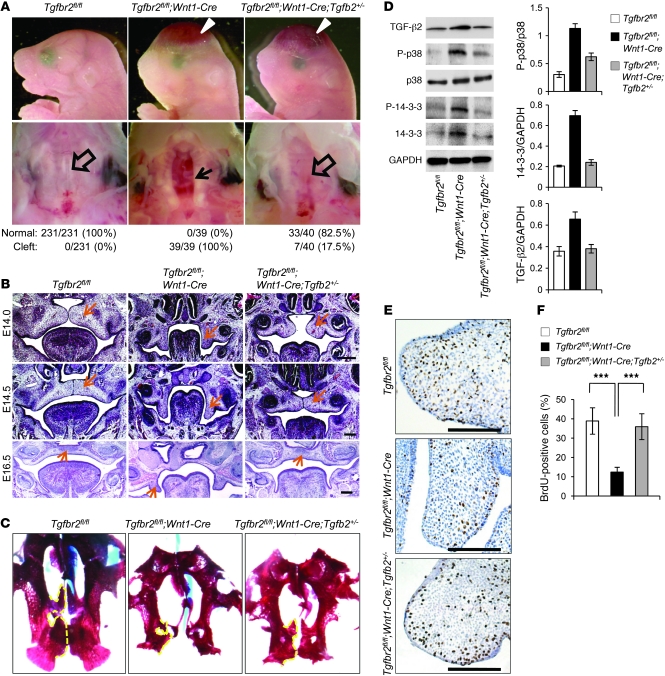
Figure 6. Rescue of cleft palate in Tgfbr2fl/fl;Wnt1-Cre mice via reduction of TGF-β2.
(A) Morphologies of newborn Tgfbr2fl/fl control, Tgfbr2fl/fl;Wnt1-Cre, and Tgfbr2fl/fl;Wnt1-Cre;Tgfb2+/– mice. The bottom row shows the macroscopic appearance of palates at the newborn stage. Arrowheads show calvaria defects. The arrow shows cleft palate, and open arrows show normal palates. Palates were scored as normal or cleft at birth. (B) Hematoxylin and eosin staining of histological sections of Tgfbr2fl/fl, Tgfbr2fl/fl;Wnt1-Cre, and Tgfbr2fl/fl;Wnt1-Cre;Tgfb2+/– mice at E14.0, E14.5, and E16.5. Arrows indicate palate. Scale bar: 50 μm. (C) Whole-mount Alcian blue–Alizarin red skeletal staining of Tgfbr2fl/fl, Tgfbr2fl/fl;Wnt1-Cre, and Tgfbr2fl/fl;Wnt1-Cre;Tgfb2+/– newborn mice. Dotted lines indicate the palatal process of maxilla and palatine bones. (D) Immunoblotting analysis of E14.5 Tgfbr2fl/fl, Tgfbr2fl/fl;Wnt1-Cre, and Tgfbr2fl/fl;Wnt1-Cre;Tgfb2+/– palates. The bar graphs show the ratios of phosphorylated p38 relative to p38, 14-3-3 relative to GAPDH, or TGF-β2 relative to GAPDH after quantitative densitometry analysis of immunoblotting data in Tgfbr2fl/fl, Tgfbr2fl/fl;Wnt1-Cre, and Tgfbr2fl/fl;Wnt1-Cre;Tgfb2+/– palates. Three samples were analyzed for each experiment. Error bars represent SD. (E) BrdU staining of Tgfbr2fl/fl, Tgfbr2fl/fl;Wnt1-Cre, and Tgfbr2fl/fl;Wnt1-Cre;Tgfb2+/– mice at E14.0. Scale bar: 50 μm. (F) Quantitation of the number of BrdU-labeled nuclei in the palate of Tgfbr2fl/fl, Tgfbr2fl/fl;Wnt1-Cre, and Tgfbr2fl/fl;Wnt1-Cre;Tgfb2+/– mice at E14.0. Three samples were analyzed for each experiment. Error bars represent SD. ***P < 0.001.

