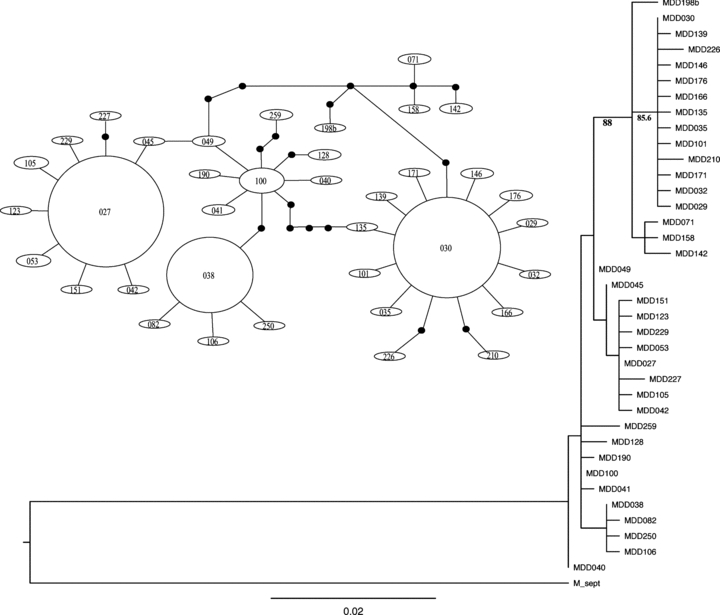
Figure 2.

Haplotype network and maximum likelihood tree based upon 654-base fragment of cytochrome b. In the haplotype network, the size of elipses indicates the relative number of individuals present in the population who carry that haplotype. Black nodes represent intermediate mutations that are not represented in the sample population. Note that numbers simply correspond to a representative sample and are not indicative of any geographic relationship among haplotypes. Bootstrap values above 80 are presented in bold at the supported nodes in the likelihood tree.
