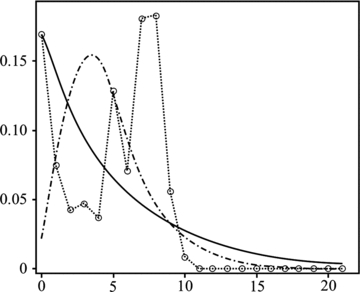
Figure 3.

Mismatch distribution based upon cytochrome b. Horizontal axis is the number of nucleotide differences in pairwise comparisons among samples; vertical axis is the proportion of pairwise comparisons with that number of differences. The solid line indicates the expected distribution if the population had historically maintained constant size, the dash-dot line indicates the expectation if the population had expanded, and the short dashed line is the observed pattern among M. lucifugus in Minnesota.
