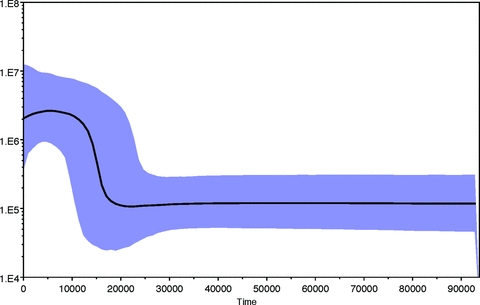
Figure 4.

Bayesian skyline plot of the median effective population size of M. lucifugus (log Ne) versus absolute time in years before present, scaled by the Myotis-specific mutation rate determined by Castella et al. 2000. Shaded area indicates 95% confidence intervals surrounding the median.
